Activity Monitor
This example is a showcase, not a beginner tutorial.
Its value is not that you should copy it directly into your own product. Its value is that it puts several Ansiq capabilities into one realistic terminal application:
- fixed shell layout
- tab switching
- process table rendering
- periodic sampling
- bottom summary panels
Run it
cargo run -p ansiq-examples --example activity_monitor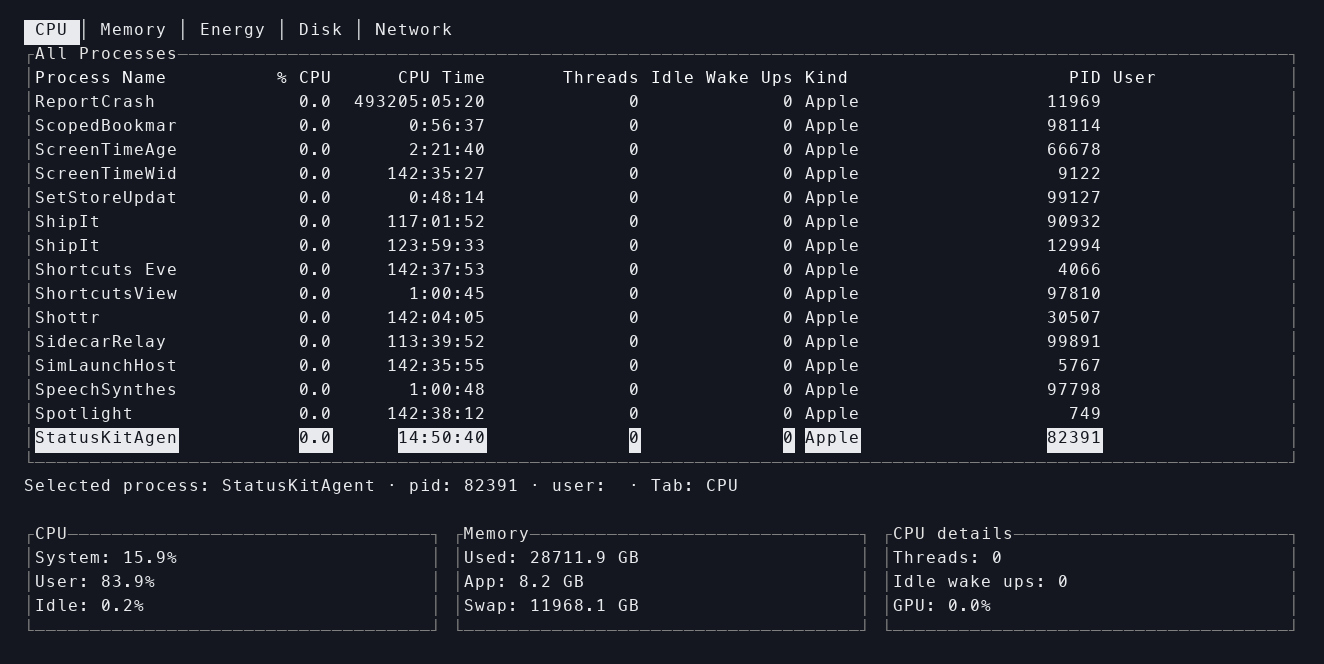
The real activity_monitor example running in a terminal.
What this example is good for
If you already understand a small Ansiq app, this example is useful because it shows:
- how to keep a shell stable while data refreshes
- how a realtime snapshot can feed the UI
- how
Tabs + Table + summary panelscooperate - why system sampling should live in a service/sampler layer instead of inside rendering code
Widgets to study alongside this example
What to observe at runtime
1. Tabs switch views, not the whole application model
The five tabs are different views over one monitoring shell. They are not five separate applications.
2. The process table is the primary dynamic region
This is a good example of why a fixed shell matters:
- the top structure stays stable
- the bottom summary does not get pushed out
- most dynamic change is concentrated in the center content region
3. The bottom summary is a second live view
It is not just footer copy. It is another state-driven panel that changes together with the table and the active tab.
How to read the code
Do not start with the table cells.
A better order is:
- inspect the snapshot model
- inspect how the sampler builds
ActivitySnapshot - inspect how the scenario tracks the active tab and selected process
- only then inspect the UI tree
This makes it easier to understand that the example is mainly about runtime + state + shell, not about a single widget.
What this example intentionally does not guarantee
The first version does not try to match macOS Activity Monitor field-for-field.
For example:
Energyis still approximateNetworkdepends on system command availability- some fields degrade under restricted permissions
That is a conscious boundary. The example exists to show how Ansiq can host a real system-data-driven TUI, not to perfectly clone Apple’s product.
How this maps back to the Guide
This example becomes much easier to understand after: